In the few days before Thanksgiving I several versions of this story, but the original was from the National Association of REALTORS®:
Existing-Home Sales Grew 3.4% in October; First Year-Over-Year Gain Since July 2021
Here are some highlights:
- Existing-home sales climbed 3.4% in October to a seasonally adjusted annual rate of 3.96 million. Sales advanced 2.9% from one year ago, the first year-over-year increase in more than three years (July 2021; +1.8%).
- The median existing-home sales price ascended 4.0% from October 2023 to $407,200, the 16th consecutive month of year-over-year price gains.
- The inventory of unsold existing homes edged higher by 0.7% from the prior month to 1.37 million at the end of October, or the equivalent of 4.2 months’ supply at the current monthly sales pace.
I have written more than once in recent months that our experience in the Austin-area market was very different than much of the U.S., with extremely high demand during the pandemic, truly painful bidding wars, and home price growth that led to the last two years of readjustment (see Latest Data on Austin Residential Market Trends and Case-Shiller Still Up While Austin Pauses).
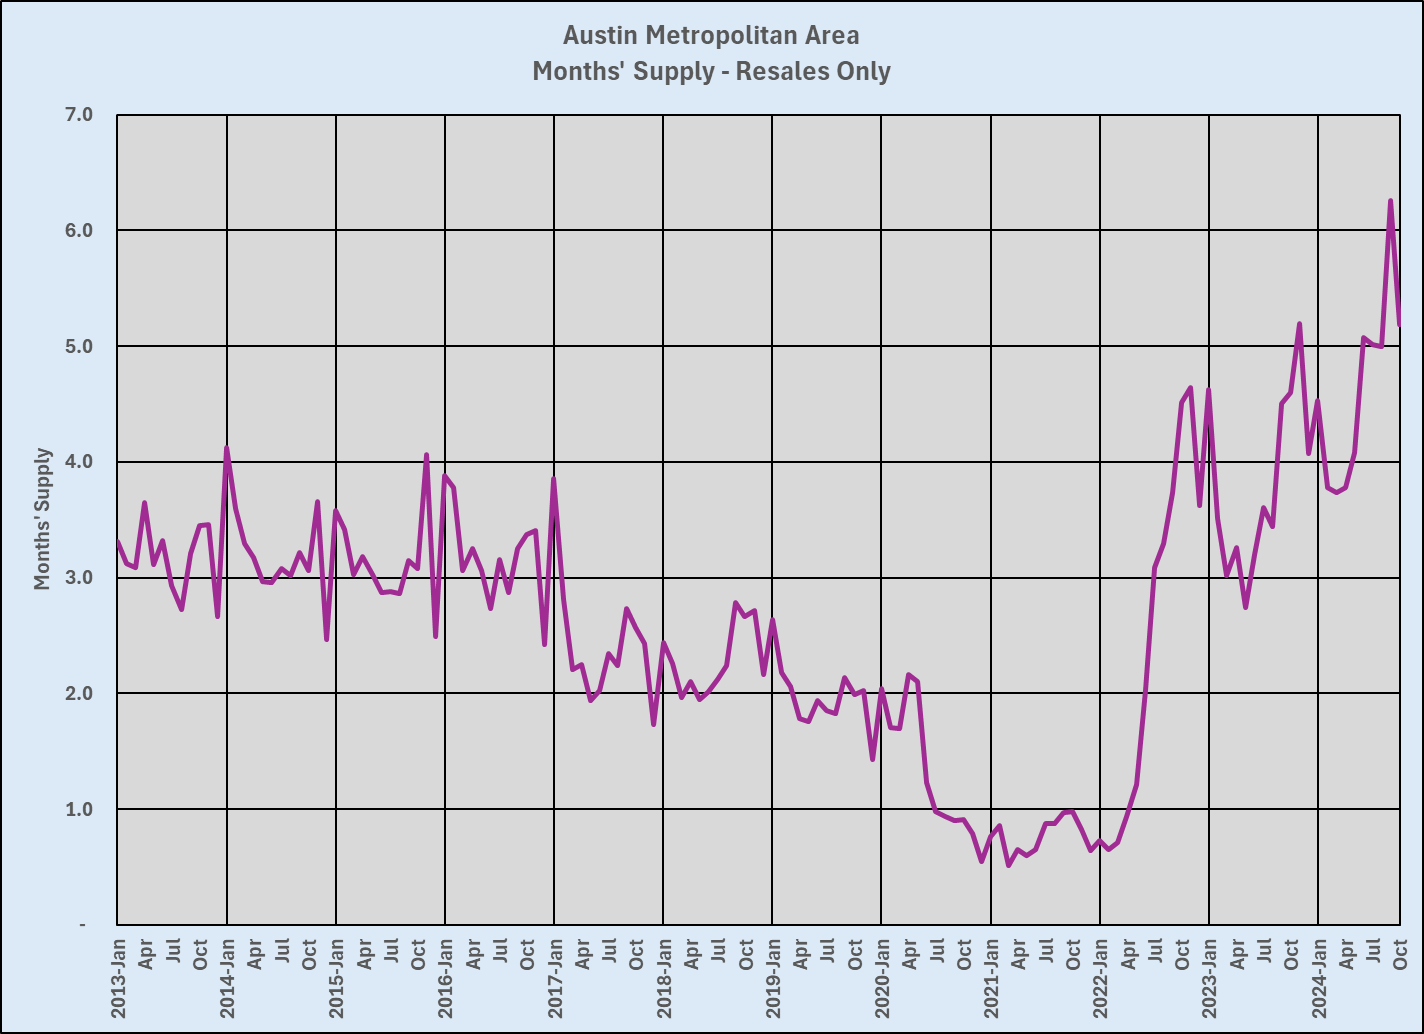
There is still contrast between the Austin-area market environment and national statistics discussed in the NAR article. This snapshot of Austin-area activity throughout this market cycle tells a very different story than in the article linked above:

Clearly, the trend of annualized sales here was downward from mid-2021 through mid-2024, but our sales in October 2024 were up 5.8%, substantially higher than the 3.4% figure highlighted in the article. It’s also important to note that our region saw year-over-year increases in sales in January, February, and April of this year, much earlier than the national report:

The 2021 peak of year-over-year sales in our area was more dramatic than the national experience, and our decline from mid-2021 to late-2022 was much steeper, a loss of 73% of unit sales between the peak and the valley you see in the charts above.
That collapse in demand led to growth in inventory at a pace we hadn’t seen before:
Like much of the U.S., Austin has under-built housing for many years relative to population growth, but our extraordinary mis-match between local/regional supply and demand, coupled with mortgage rates doubling, broad economic inflation that many prospective homebuyers had never imagined, and on-and-off rumors of a coming recession, led to the impacts on home prices that I wrote about in the Case-Shiller comparison in September.
Unlike the price appreciation mentioned in the national statistics, the median price in the Austin metropolitan area in October 2024 was $429,500, down 1.4% compared to one year earlier. The last time the median price here was lower was in March 2021, just before the pandemic began. (Yes, the median in October 2024 was down 22% from the pandemic era peak, but was 10% higher than the price one month earlier, in February 2021, and the median over five years October 2019-October 2024 was up 34%, almost 7% annual appreciation if you owned your home for all of those years.)
One last note about that last chart: The Months’ Supply metric peaked at 6.3 months in September, and declined to 5.2 months in October. The industry has long considered a 6-month supply of homes for sale to be “normal” or “balanced” conditions. This very long market cycle has distorted that perception, but don’t interpret the recent level of inventory as a terrible situation. The average Months’ Supply from 1990 through 2012 was 5.2 months, the same level we saw in October 2024.
I remain optimistic about 2025, and I will write soon about forecasts for next year. In the meantime, I will update my complete market dashboard, and keep you informed with market news as it comes.

Discussion
No comments yet.