I have commented here and in other messages that the Austin-area residential market remains more unpredictable than we have experienced for much of this very long market cycle. In the coming days, I provided a complete update of my Market Dashboard with refined data from the Texas A&M Real Estate Research Center, but this post focuses on what most individual home sellers and buyers care about — the market for resale homes — using MLS data only.
All of the charts below show this entire cycle (so far), from 2012 to Present. The first graph shows how many active resale listings we had in each month during that period and how many listings sold each month. The green line is the metric real estate professionals often discuss — how long the listing inventory will last if the current pace of sales continues — Months’ Supply:

At the beginning of the market cycle, listing inventory approached the 6-months level that we generally have considered “normal.” At that time, that level was about 8,000 active listings. Growing population and demand noticeably eroded that stock in 2017, 2018, and 2019, and we dipped below 3 months’ supply. The critical feature of this cycle is the two years from mid-2020 through mid-2022, when unit sales exceeded the number of new listings almost every month and the available supply fell to 1 month or less for 21 months. Then, rising prices and interest rates, along with general economic uncertainty, slowed demand and the available supply soared, with the number of active resale listings in April and May of 2024 the highest we’ve seen at any other point in this cycle. The Months’ Supply metric reached 5.6 months in November of 2023 and is now down to about 4 months..
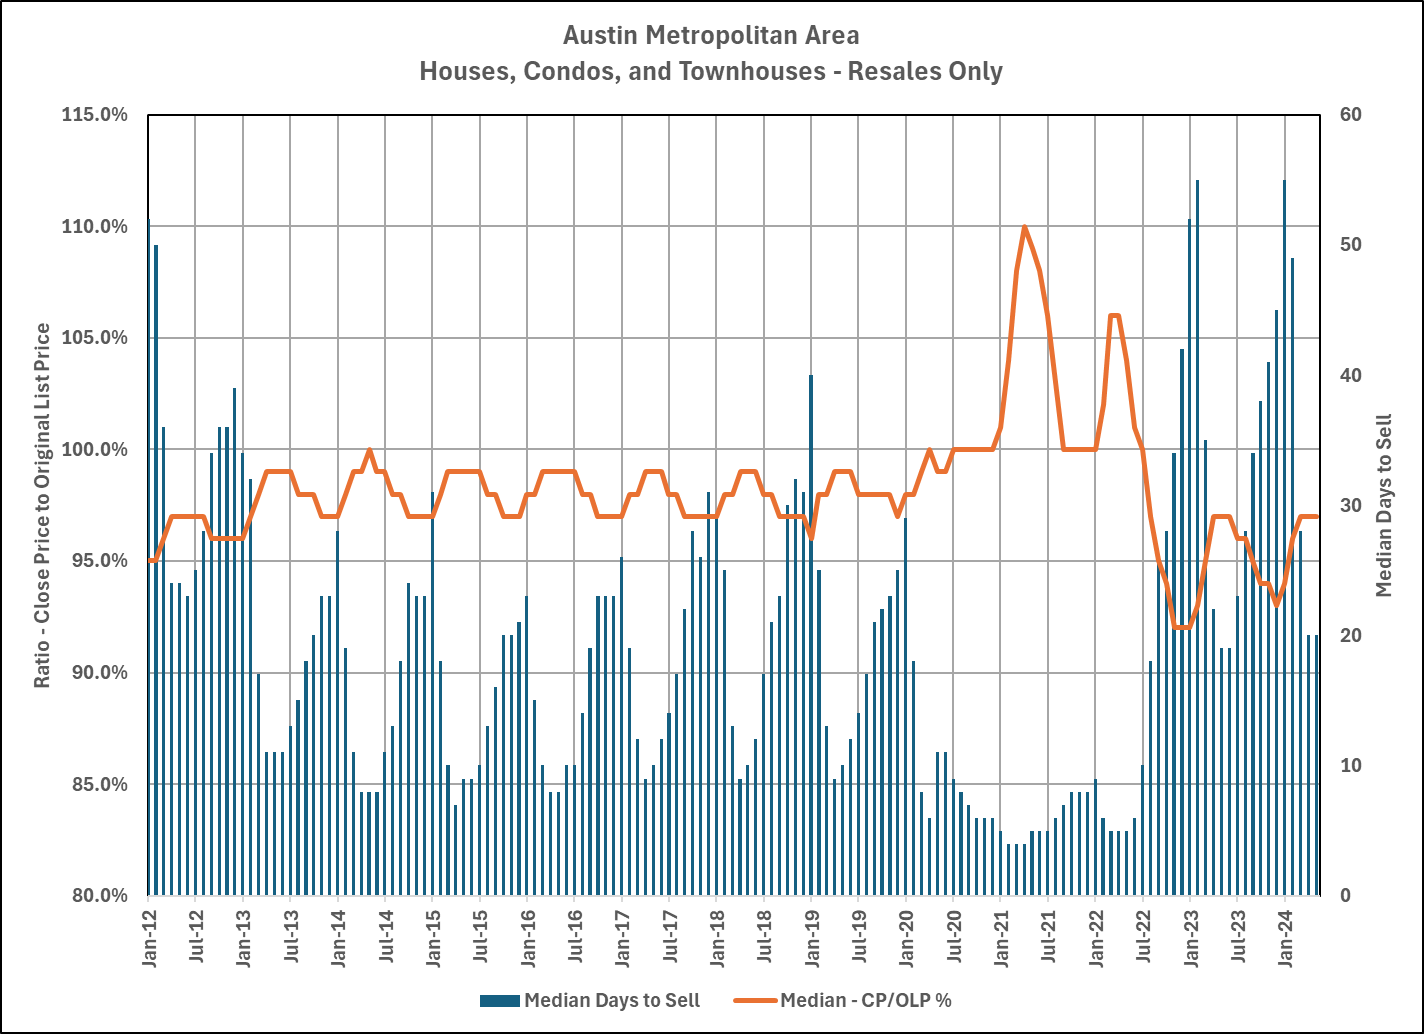
If you were participating in the market during that period of extremely low supply and high demand, you will remember the frantic activity. The previous eight years exhibited seasonal peaks and valleys, albeit with Days to Sell far below what we experienced in previous cycles. But for more than two years — March 2020 through July 2022 — median Days to Sell was 11 days or less!
During that time we saw final sales prices at or above the starting list price of more than half of all sold listings for 24 months, peaking in April 2021 (110%) and March-April 2022 (106%). With the market reset after that second peak, we now find the median close price-to-original list price ratio much lower — at or below 95% in 12 of the last 17 months.
What does than mean in dollars and cents? In the chart of sales prices below you can see that after the second peak in 2022 discussed above, sales prices followed demand downward (with modest seasonal growth), with prices in May 2024 about the same as in January-February 2022, and roughly twice what they were in 2013.
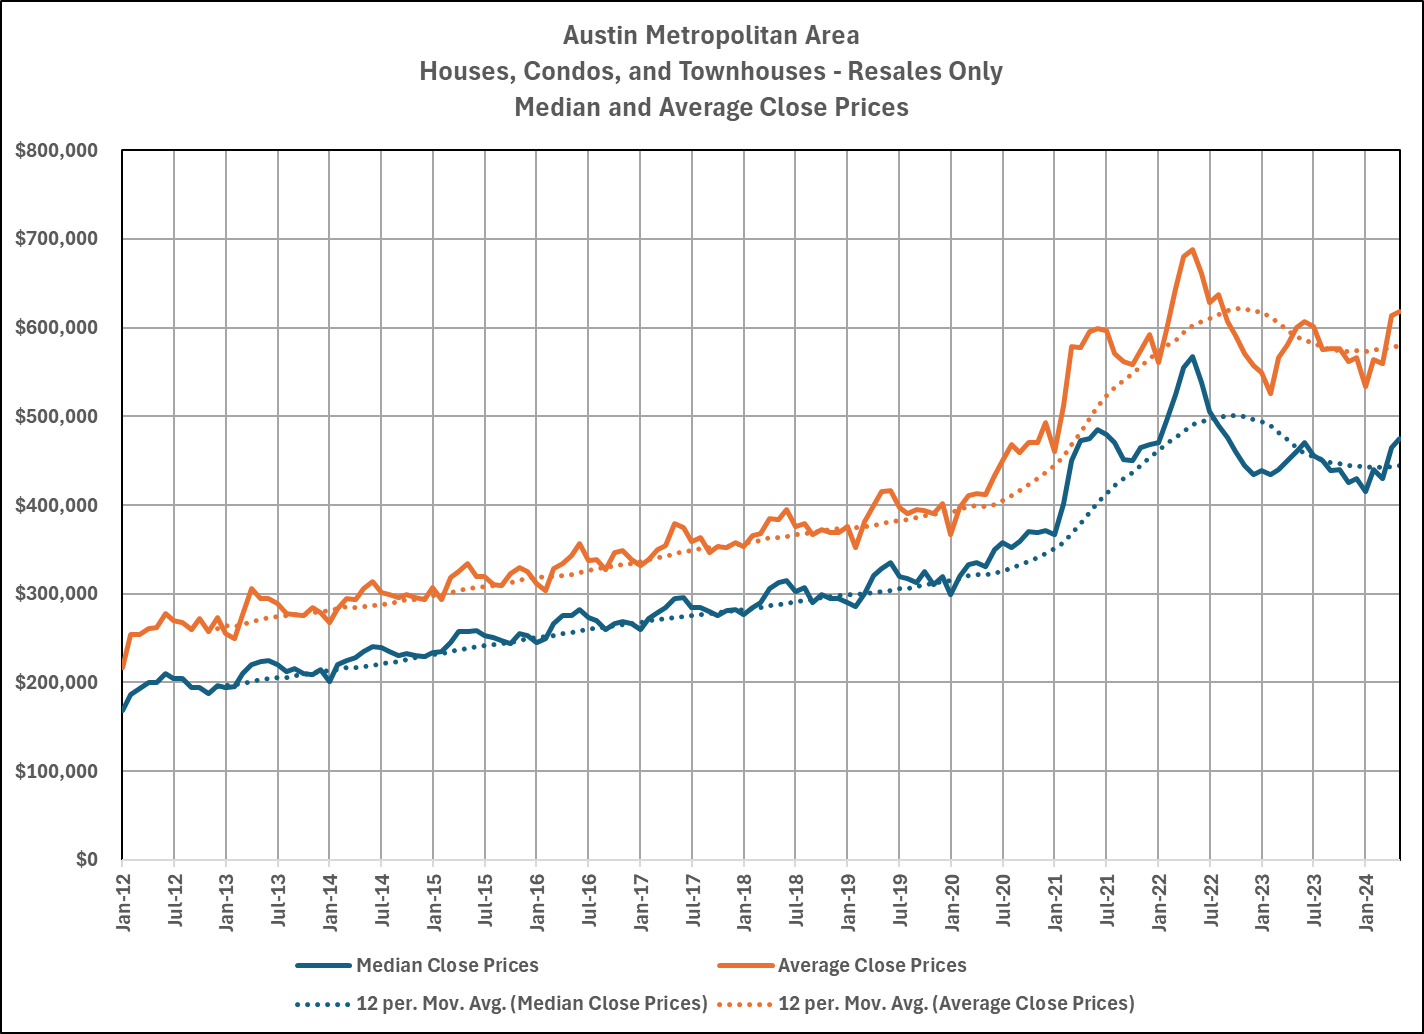
The moving averages (dotted lines) in that chart indicate that we’re leveling off year-over-year, but we don’t have a long trendline to trust quite yet. I’ll keep an eye on that trend as our market seeks balance.
I will provide a more complete view of our entire residential real estate market soon, but I hope this narrow focus on resales is helpful.

Discussion
Trackbacks/Pingbacks
Pingback: Market Dashboard Update | Bill Morris on Austin Real Estate - June 29, 2024
Pingback: Austin Home Price Distribution | Bill Morris on Austin Real Estate - July 2, 2024
Pingback: Market Dashboard and Case-Shiller Index | Bill Morris on Austin Real Estate - August 2, 2024