Since the Austin metropolitan area emerged from the last market bottom, the monthly ratio of unit sales to listings has averaged 43% (versus 27% for the past thirty years). I took note when that metric reached calendar year maximums in December 2017 and 2019 — very unseasonable compared to most of our market history. I was surprised when it went to 57% in March 2020, very surprised when it jumped to 76% in June 2020, and shocked when it increased again in July — to 83%. I am beyond amazed that it soared to 94% in August. Yes, the ratio of homes sold to the number for sale was 94%!!!
In Five year market comparison I shared some important information from Independence Title comparing sales and listing inventory over the past five years, along with changes in sale prices. In this post I’ll expand on that discussion, using my regularly published market dashboard (data from the Real Estate Center at Texas A&M University).
These charts show a longer view of the supply-and-demand environment in the Austin metropolitan area, beginning near the end of the last market cycle and continuing through August 2020:
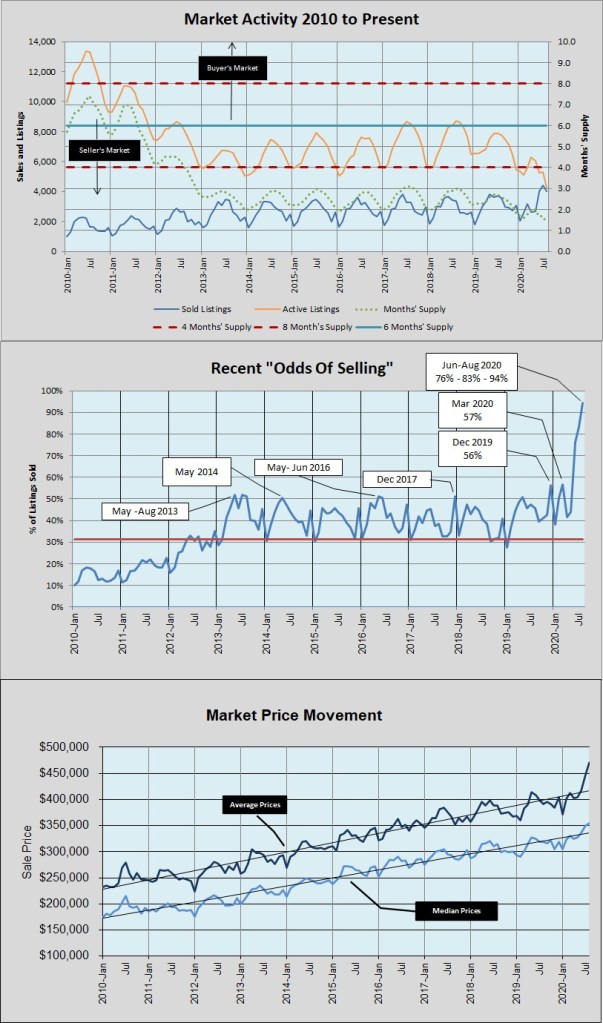
In the top chart, note the seasonal listing peaks in 2017 and 2018, and the decline since then. The steep rise in unit sales and the rapid decline in listing inventory during the pandemic this year are especially noticable, and you can see in the second chart that the ratio of sales to listings reached the all-time high I mentioned above — 94% in August! The bottom chart shows how dramatically that competition for the limited number of homes for sale has driven prices up.
Annualized trends are more useful than monthly volatility, though:

The past couple of years of changes in unit sales don’t match our experience in 2011-2013, but year-over-year sales growth averaged less than 5% for four years, then took off again in mid-2019. Compare to the first chart at the top of this post and you’ll see that matches the decline in inventory at that time.
In the early months of the pandemic, year-over-year sales fell — as much as 30% in May 2020 — the largest swing since October 2010! But July sales were almost 20% higher than the same month a year earlier — a change not seen since November 2017, and September 2013 before that! This is very unusual market volatility.
At the same time, annualized changes in median sale prices have increased from about 2.5% in late 2019 to 6% in August 2020 (with annual price increases at or above 10% for 4 of the last 7 months). With sales and inventory so nearly matched, volatility in home sales and prices will likely continue in the coming months. Will anything like “normal” seasonality affect these changes late this year? Growth in employment and population have returned quickly in the Austin area and expansions by Apple, Amazon, Tesla, and more will drive continuing demand. But the combination of pandemic fatique, home schooling, telecommuting, and major holidays make predictions less certain than in previous years. Stay tuned ….

Discussion
Trackbacks/Pingbacks
Pingback: Five-year market comparison — supply-demand tension increases | Bill Morris on Austin Real Estate - October 1, 2020
Pingback: Market pace during Covid? Fast!!! | Bill Morris on Austin Real Estate - October 3, 2020